Introduction to the Unix Shell:
Data processing using the Unix Shell - an xAPI-Enabled beginner course
This is an exercise-based introductory Unix Shell course for Data Scientists, Business and Data Analysts. An increasing amount of technical and business work occurs on Unix and Linux systems (e.g. Mac Laptops or Cloud environments). Yet the users of these systems often don’t use the full data processing capabilities available. They reach for external tools even when the inbuilt Linux Shell offers better alternatives. The present course is designed to bridge this gap by providing hands-on practice in Shell commands with examples drawn from common business tasks.
Audience: Experienced Business Analysts, Data Analysts and Data Scientists
Responsibilities: Instructional Design, eLearning Development, Graphic Design, xAPI and JavaScript, Data Analytics
Tools: Articulate Storyline 360, Adobe XD, Veracity LRS
Problem
My client is a mid-sized FinTech (Financial Technology) startup. They have a sizable number of experienced Data Analysts working in various product organizations. I interviewed a subject matter expert (SME) who is a Data Engineering Manager. He shared a couple of different reasons on why he thought the knowledge of the Unix Shell is vital for Analysts.
The Unix/Linux Shell is universally available from personal laptops to large cloud instances. Often, GUI interfaces are not available on remote servers and the Shell is the only communication medium available.
Second, Shell has an array of inbuilt tools for the most common analysis and automation tasks including row and column-based data manipulation, text filtering, file system navigation, and API access.
A surprisingly large percentage of Data Scientists and Analysts are not aware of the tools and capabilities available in the Shell. This knowledge gap:
Prevents utilization of the full power of their computing systems
Slows their workflow
Limits automation
Keeps them reliant on external GUI-based tools
Keeps them reliant on their Shell-aware coworkers
From our conversation, I also discovered that there are many Shell-scripting courses online but they are either generic or advanced. As a result, the SME needs to tutor his organization on the subset of Shell tools relevant to data and text processing. To avoid repeating the same content to new cohorts, the SME thought of organizing his instructional content.
Solution
The course needed to provide enough practical guidance that an experienced Analyst can begin automating a subset of their daily tasks. Therefore, the course needed to:
be exercise-based
draw examples from the Analysts’ routine tasks as opposed to abstract examples
provide a dataset to guide the more advanced parts
teach the Analysts how to learn on their own
My suggestion was a self-paced eLearning course, aimed to give hands-on experience working with large volumes of data without getting too advanced.
The benefits of this solution are:
Frees the SME from repetitive in-person training (cost + time effectiveness)
Flexibility for the analyst to complete the course at their own pace
Implement xAPI to enable improvements based on learner performance
Design Theory
This course is based on the Experiential Learning (learn-by-doing) approach. The course is divided into four lessons, each building on the previous one. The learner starts with simple exercises whose difficulty increases with each lesson. Each lesson provides examples and use cases for the command followed by several practice exercises to help retrieval. The questions are not scored as the goal is to prompt learners to engage with the content and not focus on the score.
The course is geared towards experienced Analysts and learn-by-doing works best when the learner has business knowledge. This technique requires learners to actively engage with the material and think of applying it in their daily work as they work through the examples.
The Process
The SME I interviewed has more than a decade of experience training Analysts. We discussed the main concepts and commands to cover in every lesson. He also shared a a set of slides used for in-person training. I augmented this material through online search and 2-3 books to find the optimal presentation format.
We started with scenario-based learning but soon realized that the Experiential (learn-by-doing) approach would be a better alternative for technical training.
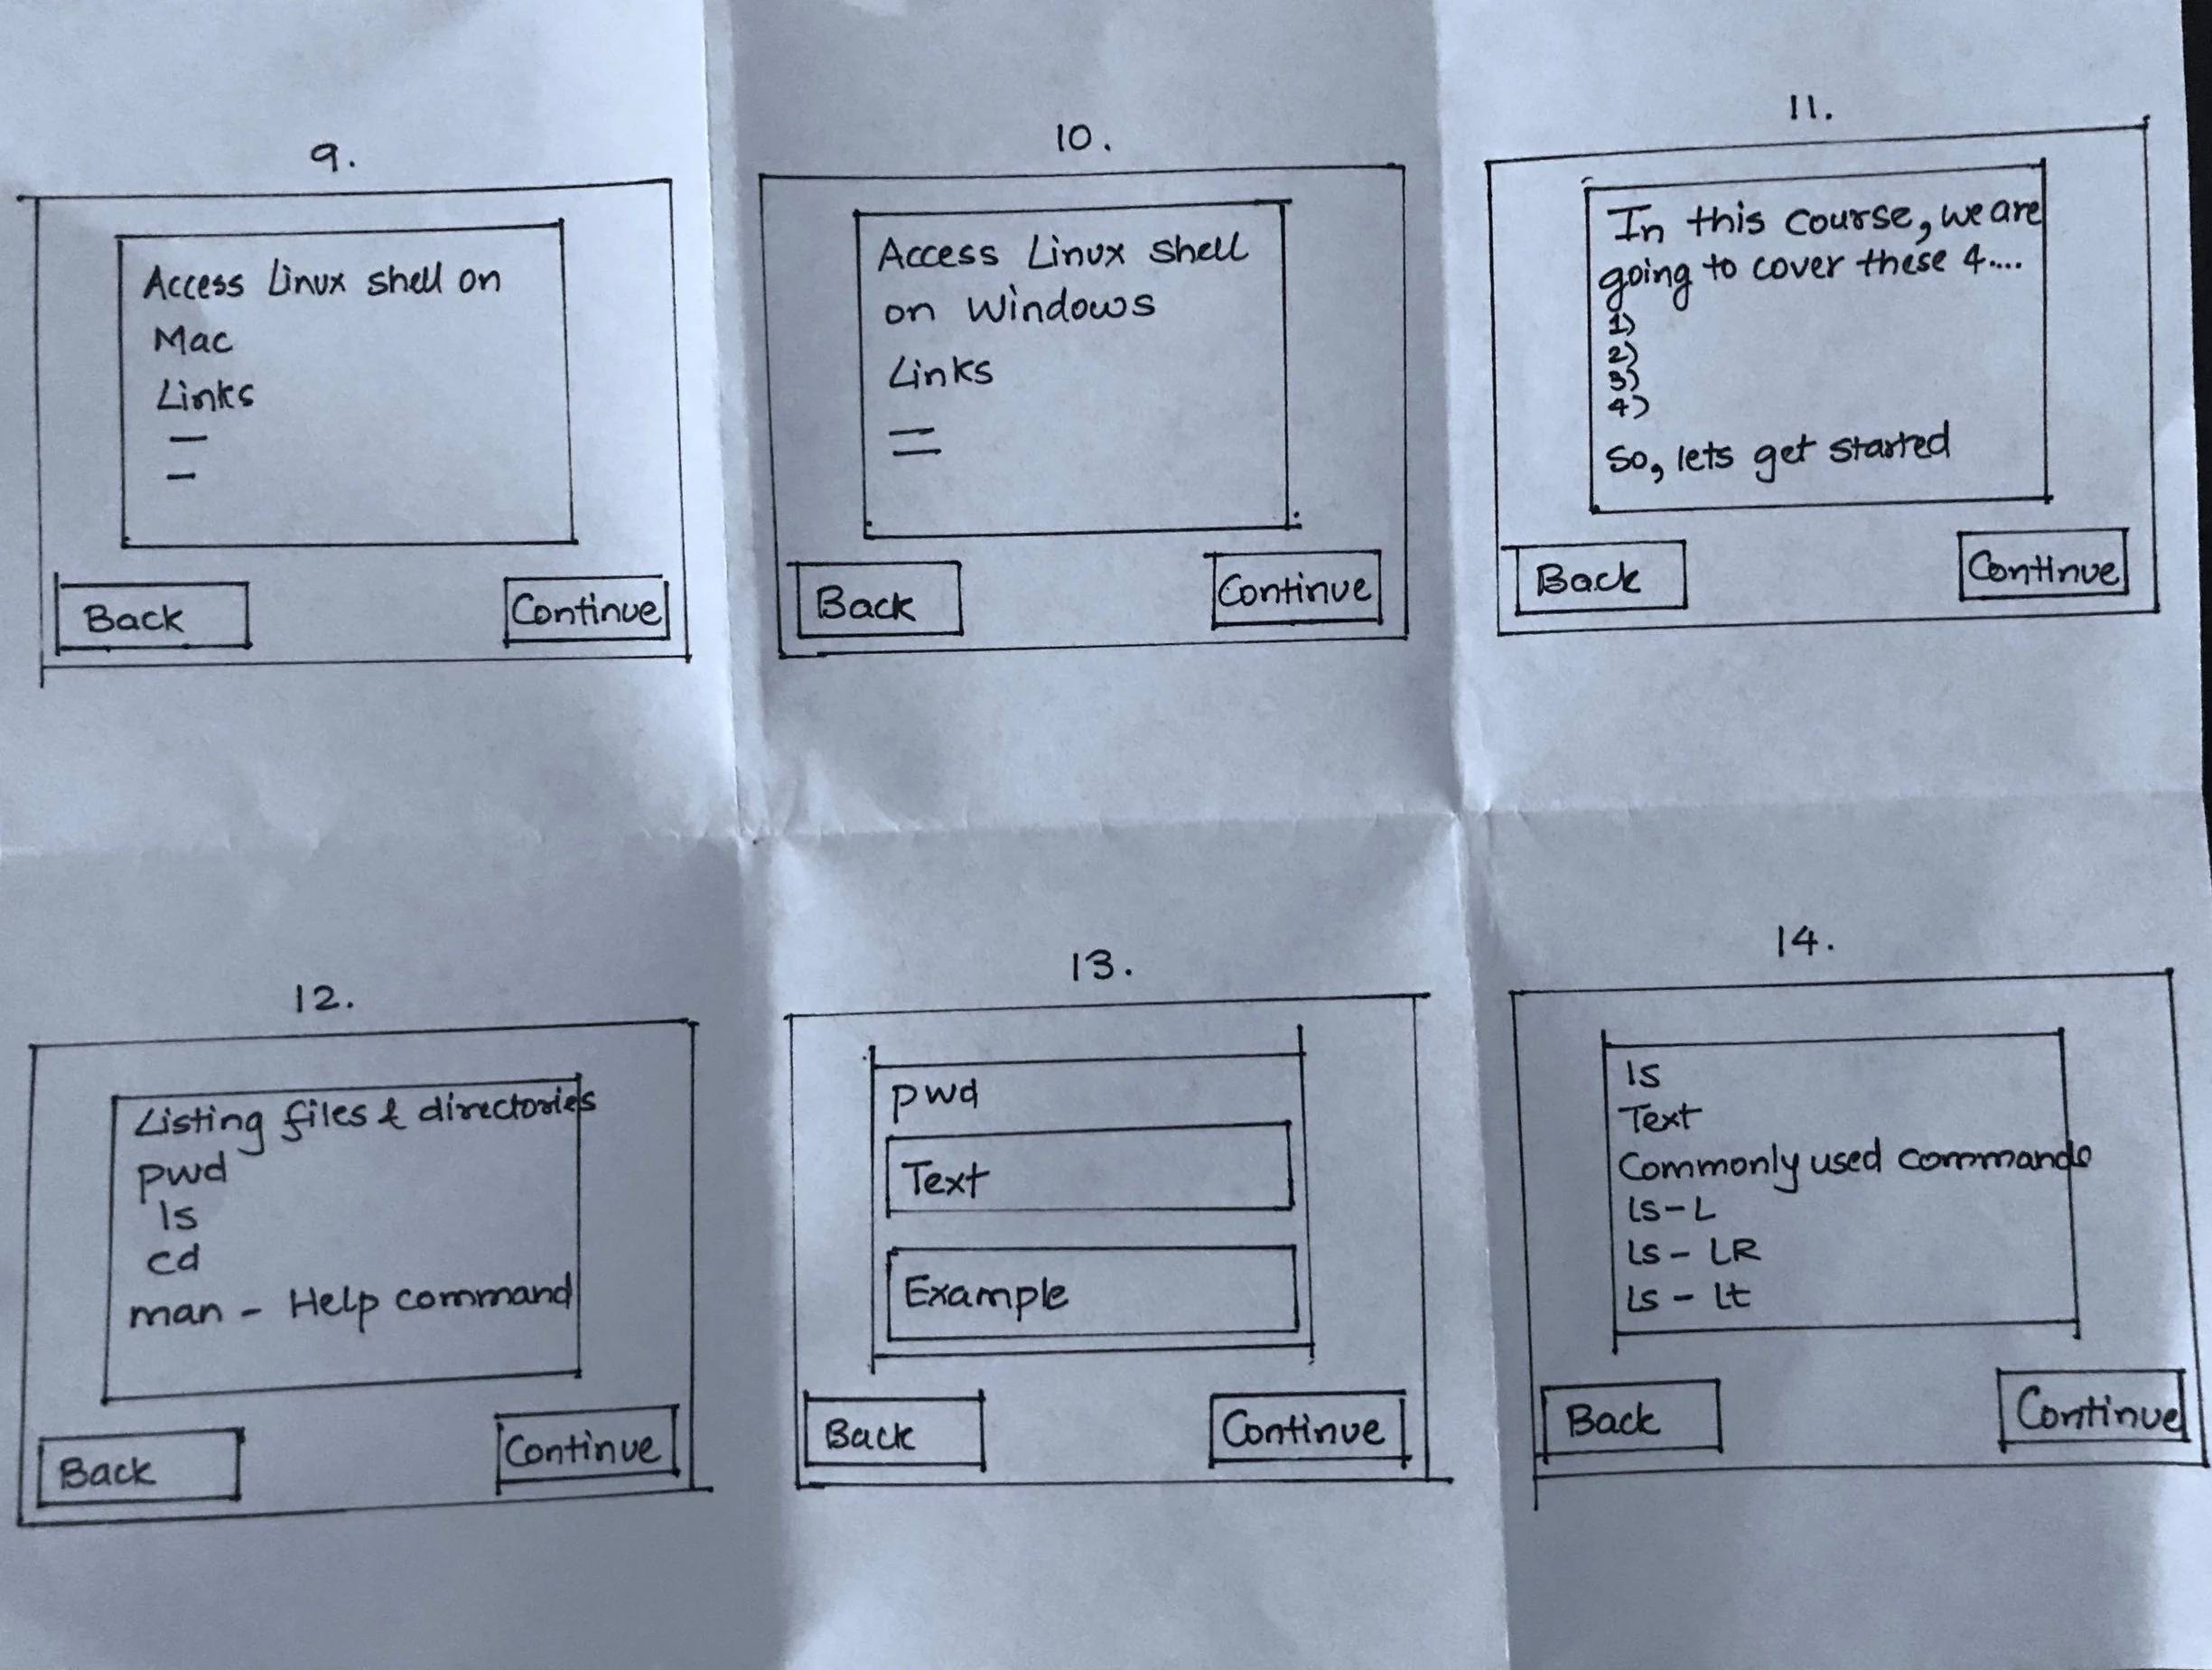
Based on the information collected from the SME, I created a visual mockup on paper highlighting the main concepts to cover with the code explanation.
Image: Mockup
Text -Based Storyboard:
The mockup was followed by a text-based story board.
Image: Text Storyboard
Visual Mockup:
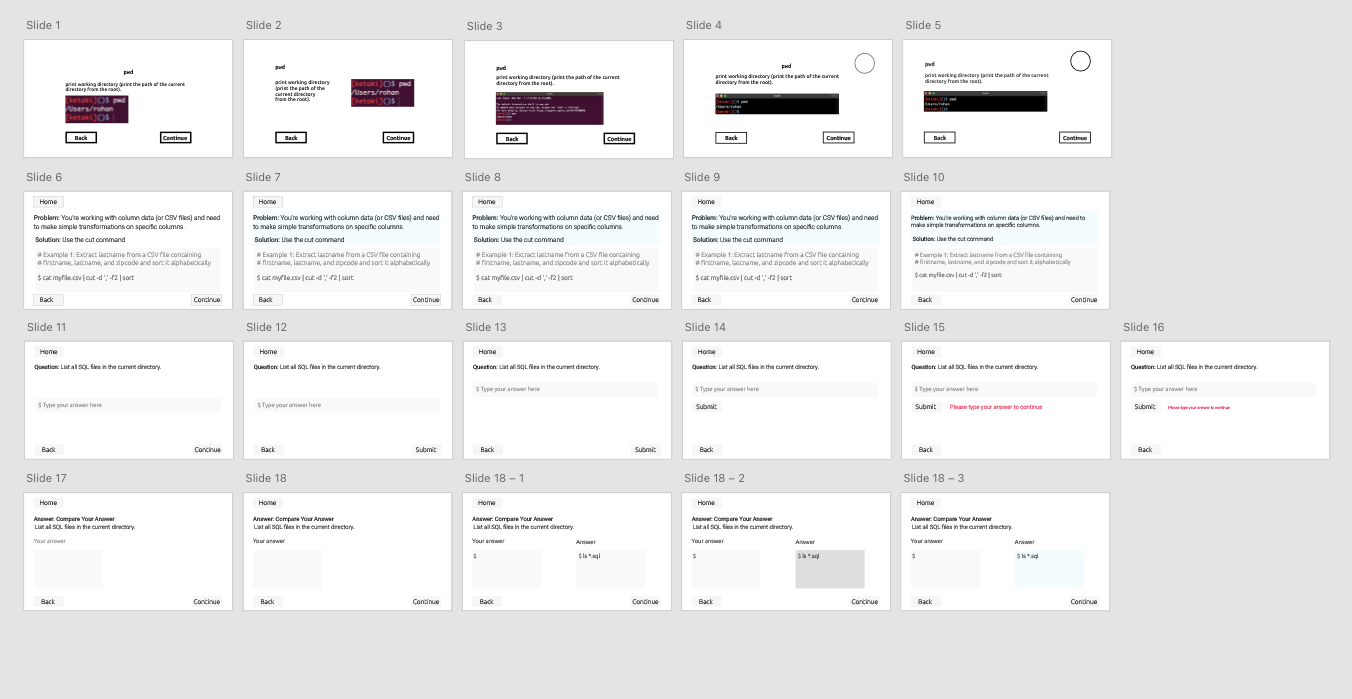
After going over the text-based storyboard with the SME, and a couple of iterations, I created a visual mockup in Adobe XD.
Image: Visual Mockup
Prototype
Next, I created an interactive prototype using Articulate Storyline 360, making extensive use of triggers, custom states, layers, variables, and conditions for developing the initial version which included the introduction and the first lesson. After getting valuable feedback on visuals and content from the SME, instructional designers, and test users, I iterated the initial prototype.
The interactions included:
Moving the name slide to the end when the learner is ready to print the certificate of completion
Changing the color of the buttons to add contrast to the slides
Adding shadow to the icons on the slide
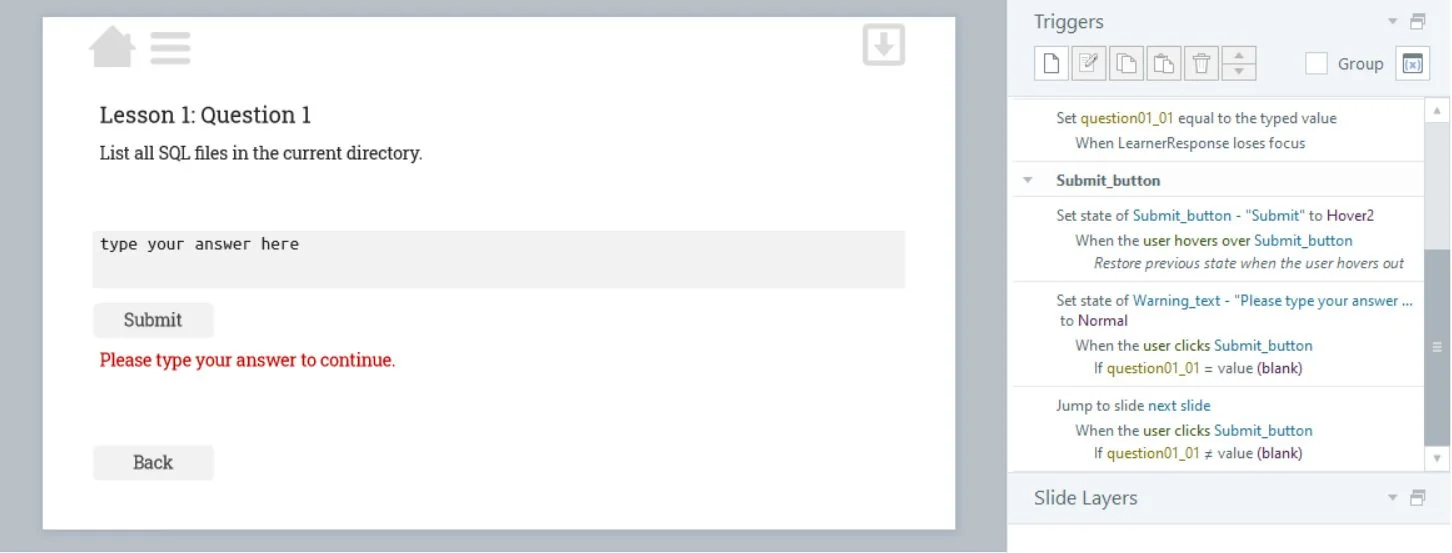
Removing the conditions on the Question slides. Initially, the question slides required the learner to provide their response before comparing their answer on the next slide. For ease of navigation, I removed the conditions on the question slide.
Image: Question slide with conditions
Development
I developed the final project in Articulate Storyline 360, including the xAPI (to track learner performance) and JavaScript (to download the printable PDF certificate on completion).
Features:
Minimalist design: I chose a minimalist design with a single color scheme, simple shapes, and two typefaces. My goal was to keep the course as simple as possible without any visual distractions.
Image: Color scheme and fonts
Image: Single color scheme
2. Feedback: When the learner submits a response to a question, that response is displayed on the next slide along with the correct answer. This allows them to compare their answer with the correct one before moving on to the next question.
Image: Answer Slide with Feedback
3. Navigation: After watching a few learners interact with the course, it became clear that learners wanted to use the course as a reference material. As a result, none of the lessons are locked. This permits dual use: sequentially as a regular course as well as non linearly as a reference, providing continued value even after the course is completed.
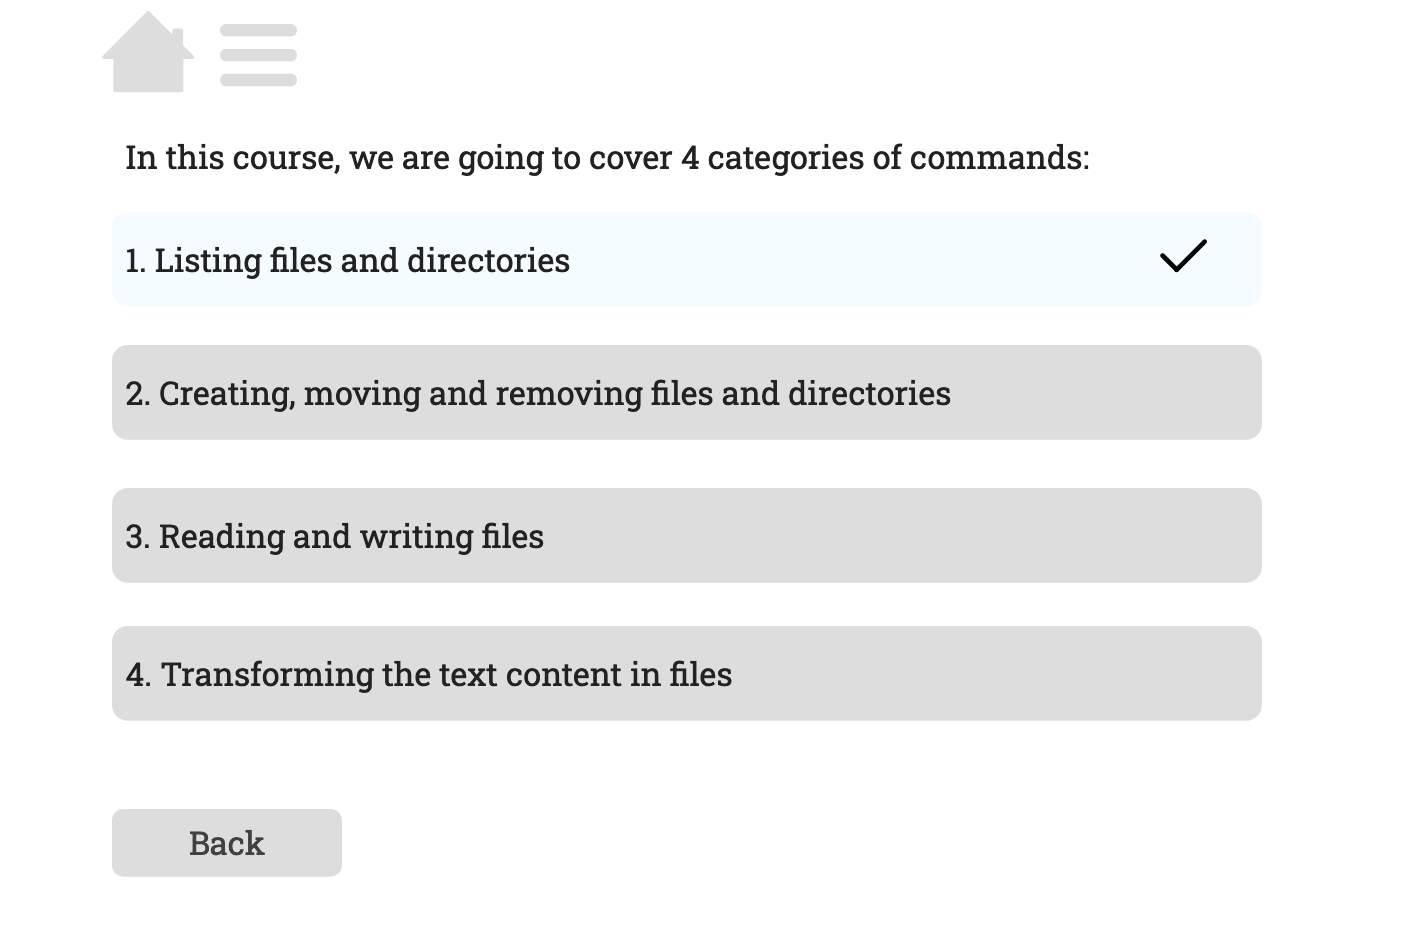
4. Checkmark on completion: On the Index slide, the color of the button changes, and a checkmark appears when the learner completes a lesson. This helps the learner to keep track of their progress, in case, they decide to come back to a lesson later (or decide to complete one lesson at a time).
Image: Check mark shows completion of lesson on Index slide
5. xAPI and JavaScript:
Tracking Answer: The learner's response to each question is collected. This helps to determine if the learners are finding a particular question challenging. This data can be used to change the level of difficulty of that question.
Image: Tracking answers on LRS
Duration on every slide: This course uses xAPI to track the amount of time the learner spends on every slide. If learners are spending too much time on a code slide, we can break down the information into small chunks. In case the learner is spending a lot of time on the question slide, the question can be reviewed to change the level of difficulty.
Image: Duration spend by learner on each slide
Completion: A completion statement is sent to the LRS after a learner completes a lesson. This data can be used to check if the learners are completing the lessons in a sequence and how long they are taking to complete each lesson.
Image: Completion data on LRS
Final Testing
I conducted final testing with the SME and a pool of learners. Based on the feedback they provided, I made some minor changes. This course is currently being used by Data Analysts/Scientists in the startup.
